Introduction
OpenTrack began in the mid-1990s as a research project at the Swiss Federal Institute of Technology. The aim of the project Object-Oriented Modeling in Railways, was to develop a catalyst for practical economic solutions to complex railway technology problems.
Today, the railway simulation tool OpenTrack is a well-established railway planning software and it is used by railways, the railway supply industry, consultancies and universities in different countries.
OpenTrack allows to model, simulate and analyze the following types of rail systems:
OpenTrack supports the following kinds of tasks:
- Determining the requirements for a railway network’s infrastructure
- Analyzing the capacity of lines and stations
- Calculation of minimum headways (headway calculation), e.g. using the OpenTrack tool Headway Calculator
- Rolling stock studies (for example, future requirements)
- Running time calculation
- Timetable construction; analyzing the robustness of timetables (single or multiple simulation runs, Monte-Carlo simulation)
- Evaluating and designing various signaling systems, such as discrete block systems, short blocks, moving blocks, LZB, CBTC (communication-based train control), ATP, ATO, ETCS Level 1, ETCS Level 2, ETCS Level 3 (see also: ERTMS), PTC (Positive Train Control)
- Analyzing the effects of system failures (such as infrastructure or train failures) and delays
- Calculation of power and energy consumption of train services
- Simulation of railway power supply systems (using OpenPowerNet)
Data
Network data
OpenTrack describes a railway network in special graphs called double vertex graphs. A user can edit the network’s topology graphically. Every element of the graph holds various attributes. An edge, for example, holds its length, the gradient, the maximum speed for different train categories and much more. A user can create and manage objects for edges and vertices, and also signals, switches, stations and routes. The following figure shows part of a topology.
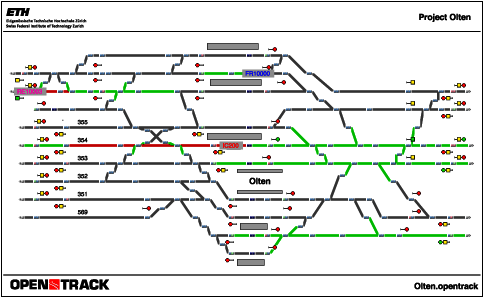
Example of a station (Olten, Switzerland). This graphic is also available as a
PDF document.
Rolling stock data
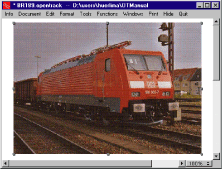
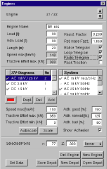
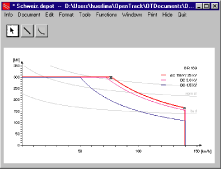
OpenTrack stores each locomotive’s technical characteristics, including tractive effort/speed diagrams, load, length, adhesion factor, and power systems. A database organizes locomotives into groups called depots. A simulated train uses one or more locomotives from a depot together with a number of passenger or freight cars (carriages or wagons). Trainsets are also organized in a database.
Timetable data
The timetable database stores information for each train at each station, including arrival and departure times, minimal stop time, and connections to other trains.
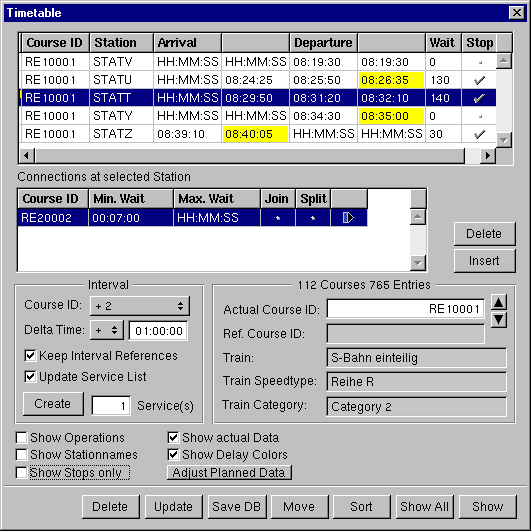

The user can edit the timetable data either in textual form (left window) or directly within the train graph by using the mouse (right window) (See also: video section).
A user can compare timetable and actual data either in a table or directly in the train graphic.
Interfaces
OpenTrack offers interfaces to general data formats (such as ASCII and XML) and to some railway-specific formats (including FBS, Protim, Simu VII and others).

OpenTrack also supports railML, the XML-based standard format for the exchange of railway data. Download the railML product sheet (PDF-File, 800 kB).
| Timetable data |
Import |
Export |
|
|
|
| railML (Versions 1.0 and 2.2) |
X |
X |
| ASCII |
|
X |
| MS Excel |
X |
X |
| OpenTrack ASCII |
X |
X |
| OpenTrack XML |
X |
X |
| Viriato (via railML) |
X |
X |
| FBS (via railML) |
X |
X |
| Simu VII (IBS GmbH) |
X |
|
| UK Planning Inferface Format (.PIF-Format, Protim) |
X |
|
| SimWalk (via railML) |
X |
X |
| Rolling stock data (tractive effort/speed diagrams) |
Import |
Export |
|
|
|
| railML (Versions 1.0 and 2.2) |
X |
X |
| OpenTrack ASCII |
X |
X |
| SimWalk (via railML) |
|
X |
Simulation
The following figure shows how the simulation tool works. Predefined trains run according to the timetable on a railway network. During the simulation, OpenTrack calculates train movements under the constraints of the signaling system and timetable. After a simulation run, OpenTrack can analyze and display the resulting data in the form of diagrams, train graphs, occupation diagrams and statistics.
OpenTrack handles single simulation runs as well as multiple simulation runs where random generators produce different initial delays and station delays.
Animation of the simulation
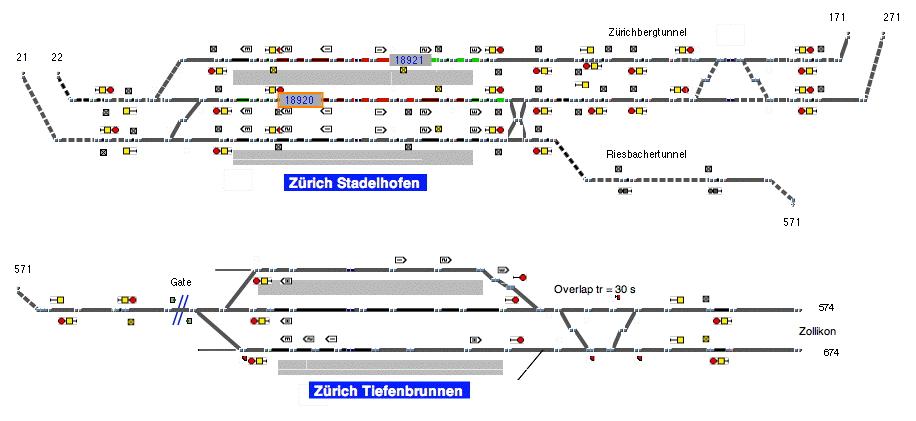
Screenshot of OpenTrack during the simulation. The video can be downloaded.
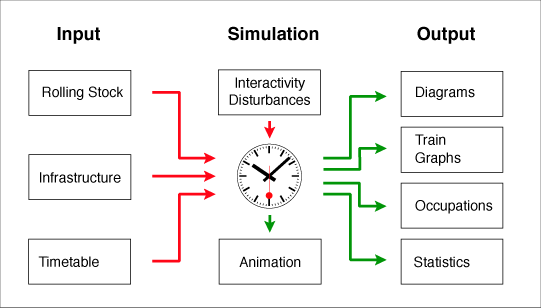
The modules of the simulation (this graphic is also available as a PDF document)
During the simulation, trains try to obey the given timetable. The differential equations for speed and distance are the basis for calculating a train’s movement. The signaling system of the railway network poses constraints. Occupied tracks and restrictive signal aspects may impede a train’s progress.
During the simulation, every train continuously stores its speed, acceleration, position, power consumption and other data. This data can be evaluated after the simulation.
The user can watch the simulation in an animation mode, which shows the trains running and lets the user analyze occupied tracks, reserved tracks and signal aspects..
Headway Calculator / Headway Calculation
Based on a number of input parameters, the headway calculator computes the minimum headway between two trains and is able to identify the critical block section. The two trains may vary in type (e.g. intercity, commuter, freight, etc.), route and stopping pattern. The headway calculation works for fixed block (discrete block), moving block and CBTC systems.
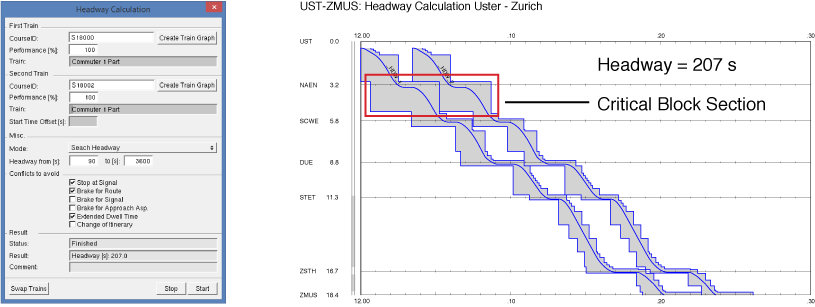
This graphic is also available as a
PDF document.
Output data
After a simulation, OpenTrack offers a number of evaluations. Evaluations of a train, line or station are possible. For a train, OpenTrack offers diagrams such as acceleration vs. distance, speed vs. distance, and obstructions. For a line, there are evaluations in the form of diagrams of train movements, route occupation and line profiles. Every station produces output about all the trains that used it, including arrival, stopping and departure times.
The user can view output data in a diagram, or export or evaluate it in a readable ASCII table.
The OpenTrack application
The OpenTrack application is available for the following operating systems: Windows XP, Windows Vista, Windows 7 (32 and 64 Bit), Windows 8 (32 and 64 Bit), Mac OS X and MacOS X Server.
The application is available in two versions. The
full version of OpenTrack offers an unlimited number of running trains per simulation. The limit of the OpenTrack
Light version is two trains per simulation.
Screenshots
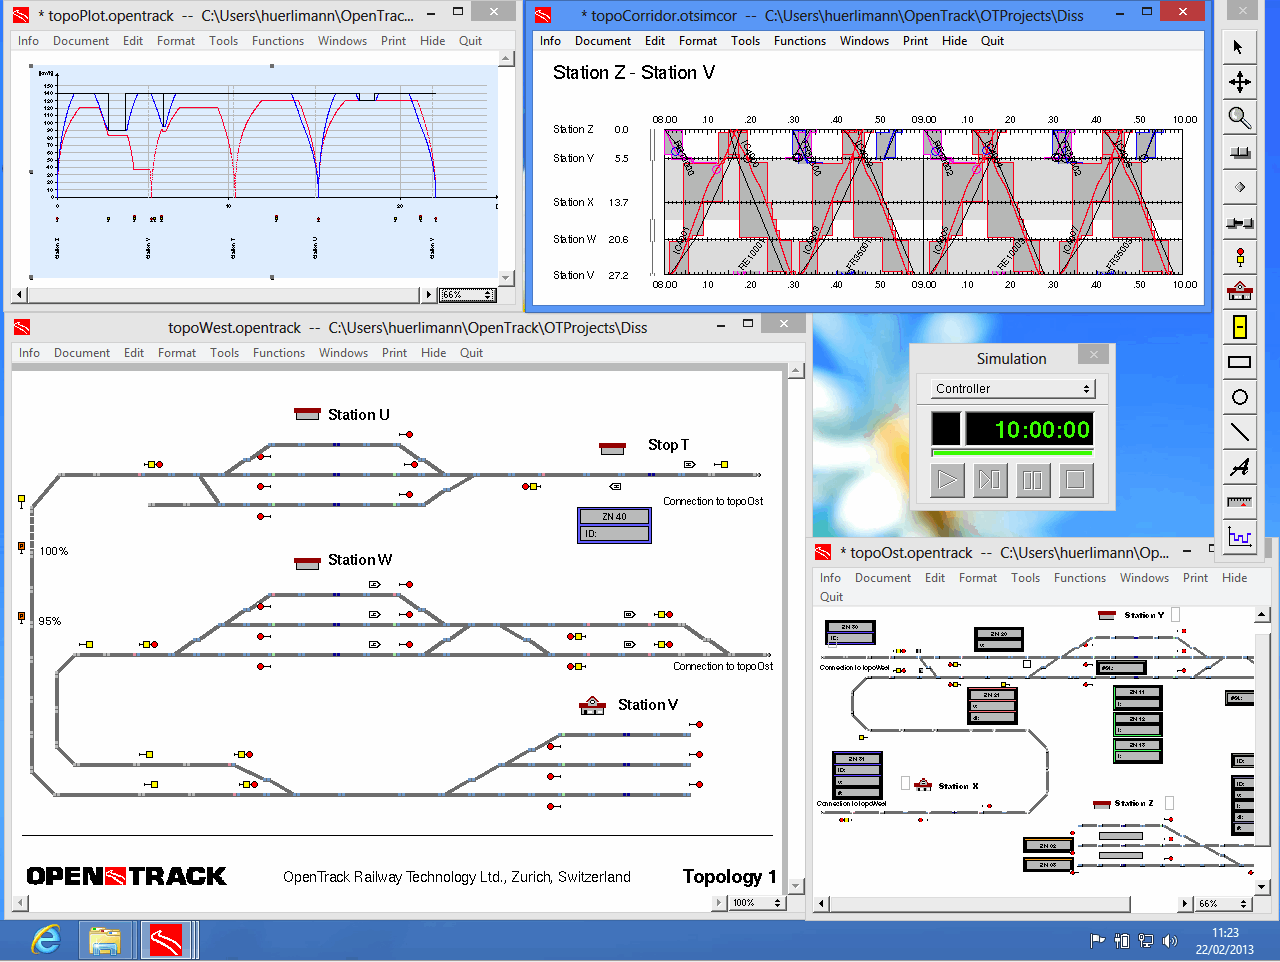
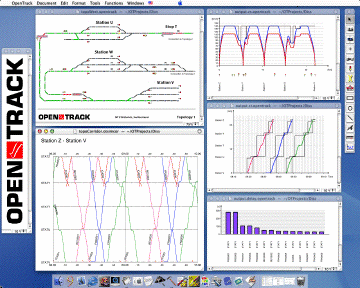
The following images are examples of the graphical user interface of OpenTrack for different Windows versions and MacOSX.
Outputs
OpenTrack produces a number of outputs in text and/or graphic form.
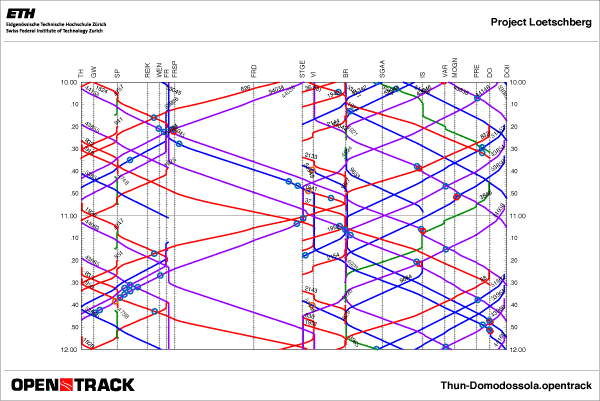
Train graph (offline and online visualization). This graphic is also available as a PDF document.
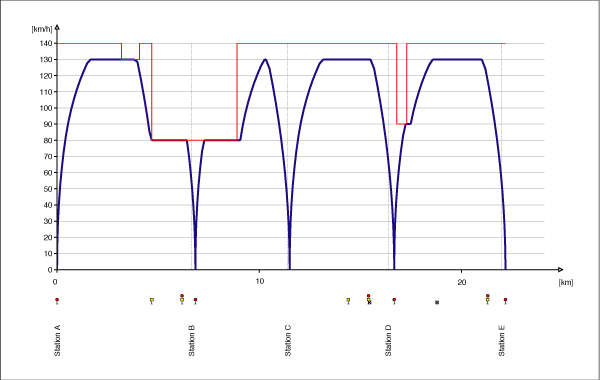
Speed/distance diagram
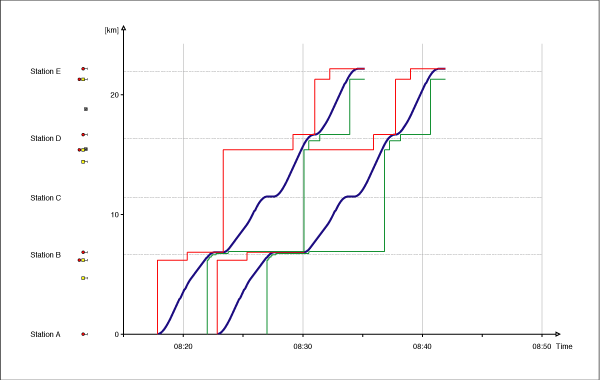
Distance/time diagram

Power and energy output (red:Power in, blue: mech. Power, green: energy/distance-diagram)
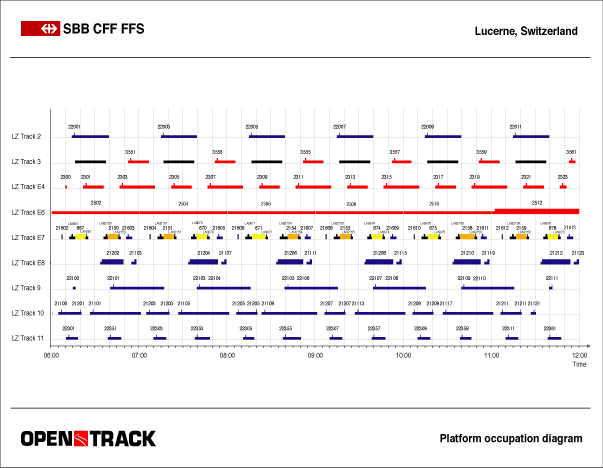
Occupation diagram
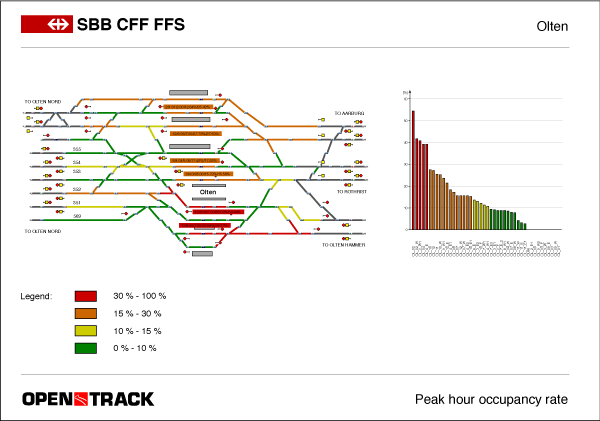
Occupation statistics (example: peak hour occupation percentage). This output is available as a PDF document.
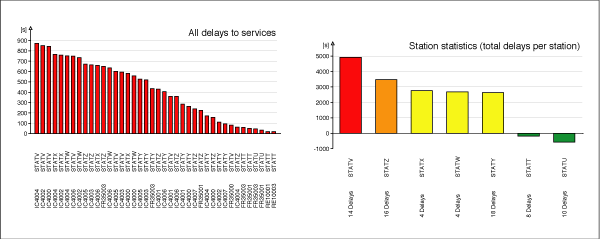
Delay statistics
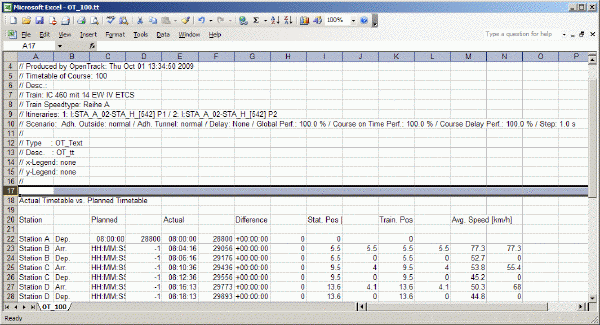
A user can obtain every output in the form of ASCII text, for import into Microsoft Excel for example.
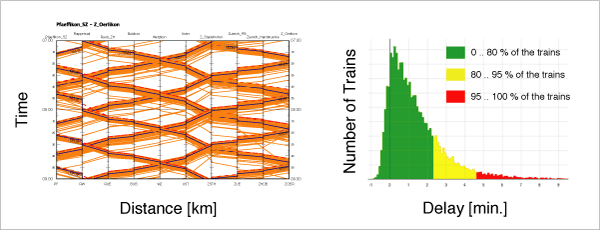
OpenTimeTable is able to visualize and analyze the outputs of multiple OpenTrack simulation runs.
OpenTrack API
OpenTrack offers an application programming interface (API) to connect other applications with OpenTrack. The other application can send standardized commands to OpenTrack and gets defined status messages back from OpenTrack. Technically, SOAP-Messages are exchanged via HTTP (SOAP over HTTP).

Possible applications:
- Implementation of customer-specific Dispatching Algorithms
- Comparison of new Dispatching Strategies
- Development and Analysis of new Concepts in Train Control (e.g. optimizing Energy Consumption, reducing Delays and Conflicts)
- In-depth Evaluation of Railway Operations
A
presentation of the OpenTrack API allows a better insight into the functionality of the API. (
Download of the presentation - PDF, 2.9 MB). For further information on the OpenTrack API, please contact us.
Partners and customers
In the OpenTrack project, our company and the Institute for Transport Planning and Systems of the ETH Zürich co-operate with a number of partners from railway companies, the railway supply industry, consultancies and universities. More than 220 companies and organizations use licenses of OpenTrack.
The complete list of users can be found on the
desktop version of our website.
Documents / downloads
PDF files related to OpenTrack
- OpenTrack Brochure in English, German, French, Spanish, Portuguese, Czech, Russian, Bulgarian or Serbian (PDF Format).
- Short Description about OpenTrack (six pages) in English, German, French, Spanish, Czech, Russian, Bulgarian or Serbian (PDF Format).
- Abstract (PDF format) of dissertation number 14281, “Object oriented modeling in railways”, which describes the basics of OpenTrack. Swiss Federal Institute of Technology (2 pages, German and English).
- OpenTrack-Logo (ZIP Format): This file contains two different OpenTrack logos in the .EPS, .GIF and .BMP formats.
Article in the journal "Güterbahnen" (Freight Railways)
Issue 2/2003 of the journal Güterbahnen included the article ""Ermittlung und Leistungsfähigkeit einer Werkbahn mit OpenTrack" (Investigations on the Capacity of an Industrial Railway with OpenTrack). We would be pleased Holland Railconsult. The report can be downloaded as a PDF file (in Dutch).
Comprail 2004 conference paper
Our paper Railroad Simulation using OpenTrack was presented at the Comprail 2004 conference in Dresden, Germany.
Railway Gazette 04/2006
In issue April 2006 of the journal Railway Gazette the authors T. Salt and K. Mears from Interfleet Technlology published an article "Automation gets the most out of mining railway infrastructure". We would be pleased to send you a free copy of the article.
Australian Government: North-South Rail Corridor Study
The North-South Rail Corridor Study (where OpenTrack was used as one of the tools) has comprehensively examined the adequacy, given the current major infrastructure investment programme, of the existing Melbourne-Sydney-Brisbane rail corridor to meet future freight demand.The study examined different options, including possible enhancements to the coastal line, as well as alternative inland routes. Key issues included infrastructure links, engineering, environmental, urban and regional planning issues. A financial and economic analysis was also undertaken on each of the route options.
OpenPowerNet - Simulation of Railway Power Supply Systems
Presentation about the Simulation of Railway Power Supply Systems (Co-Simulation of OpenPowerNet with OpenTrack) (PDF, 2.7 MB, Download).
Two screenshots from the OpenPowerNet project for Zurich (simulation of tram system Zurich) after the postprocessing of the OpenTrack output data to Google Earth. © 2008 by IfB.
Railway Gazette 07/2008
Sharing tracks in Sydney is the title of an article published in the Railway Gazette 07/2008 by Ian Imrie from Plateway. The article describes the complexity of sharing tracks between freight and passenger trains in the Sydney area.
Supporting the study, the two Swiss Tools Viriato and OpenTrack were used with success.
Presentation to RTSA Wellington (NZ)
The company
Plateway from Clyde, Australia gave a
presentation about OpenTrack and simulation tools in general in June 2012 to RTSA in Wellington.
More reports in German
You’ll find more reports on the use and development of OpenTrack in the
German section of our web page.
OpenTrack Videos
The following links require Apple Quicktime Player or Windows Media Player. Otherwise the the videos can be watched on
YouTube.


Watch all the OpenTrack-Videos on
YouTube.
OpenTrack on LinkedIn
Follow us on LinkedIn:
OpenTrack Railway Technology Ltd. on LinkedIn
OpenTrack - Simulation of Railway Networks on LinkedIn
Further information
For further information on OpenTrack, please contact:
OpenTrack Railway Technology Ltd
Gubelstr. 28
CH - 8050 Zürich
Switzerland
Phone: + 41 - 44 - 310 19 90
Fax: + 41 - 86 - 044 310 19 90
E-Mail:
info@opentrack.ch
OpenTrack web site
 To the OpenTrack web site.


